Virgo Constellation Data Analysis
Visual Star Map & Statistical Analysis, built from a small dataset collected from a Hubble Space Telescope image of the Virgo constellation.
Project motivation
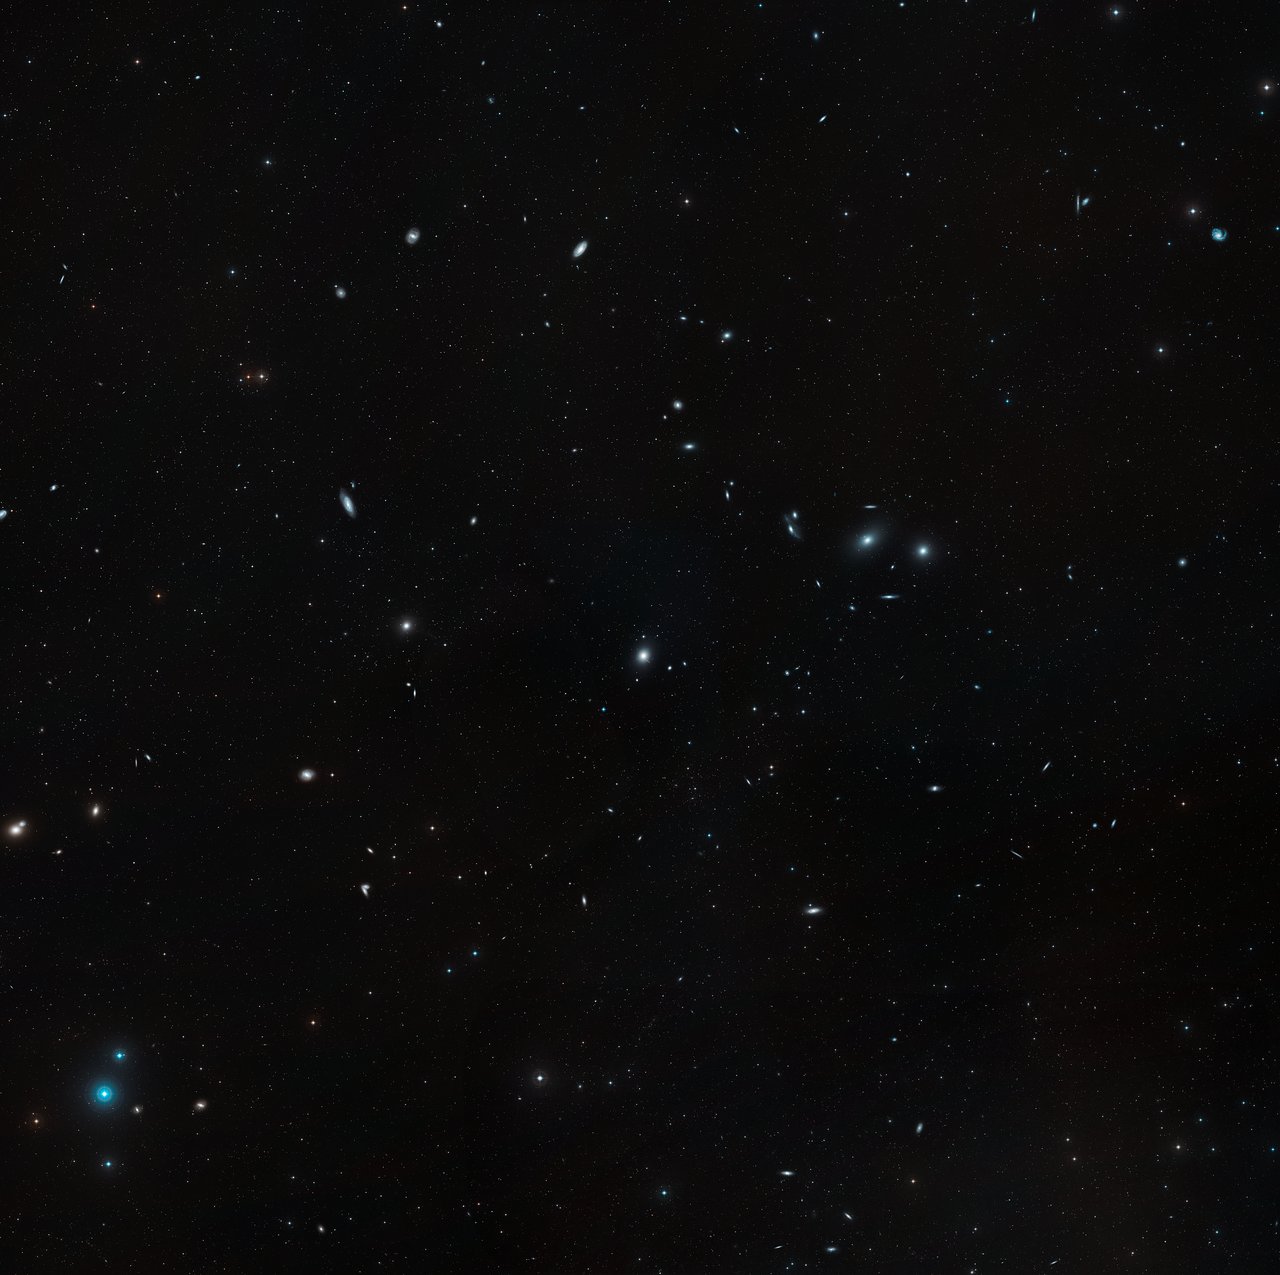
I wanted hands-on practice with real astronomical imagery and basic data analysis, rather than only reading about how astronomers work with star data. Using an image of the Virgo constellation captured by the Hubble Space Telescope gave me a concrete, real source to build a small dataset from and practice statistics on.
Source image
Data collection method
Stars visible in the source image were identified and their approximate properties (such as position and relative brightness) were recorded manually into a spreadsheet, forming a small, hand-collected dataset rather than an automated survey extraction.
Dataset
Excel analysis
Basic statistical summaries and organisation of the star dataset were carried out in Microsoft Excel.
Matplotlib visualisations
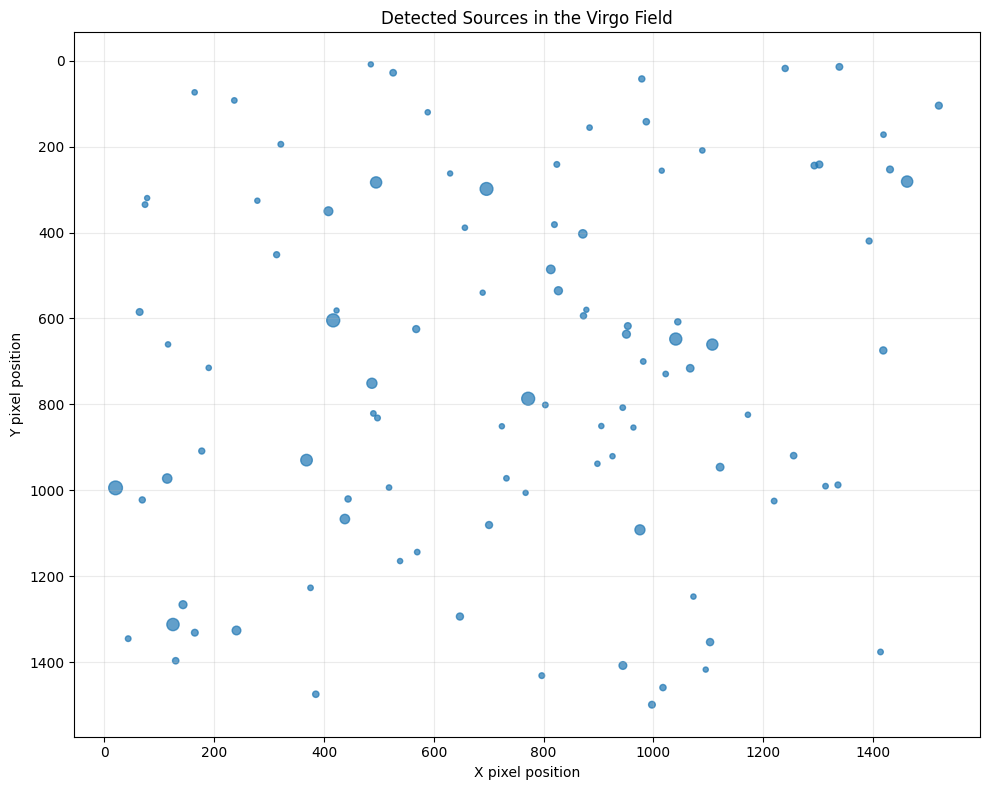
Matplotlib was used to visualise the star data, including a visual star map representation.
Statistical observations & results
Observation
- The dataset contains 100 detected sources from the image.
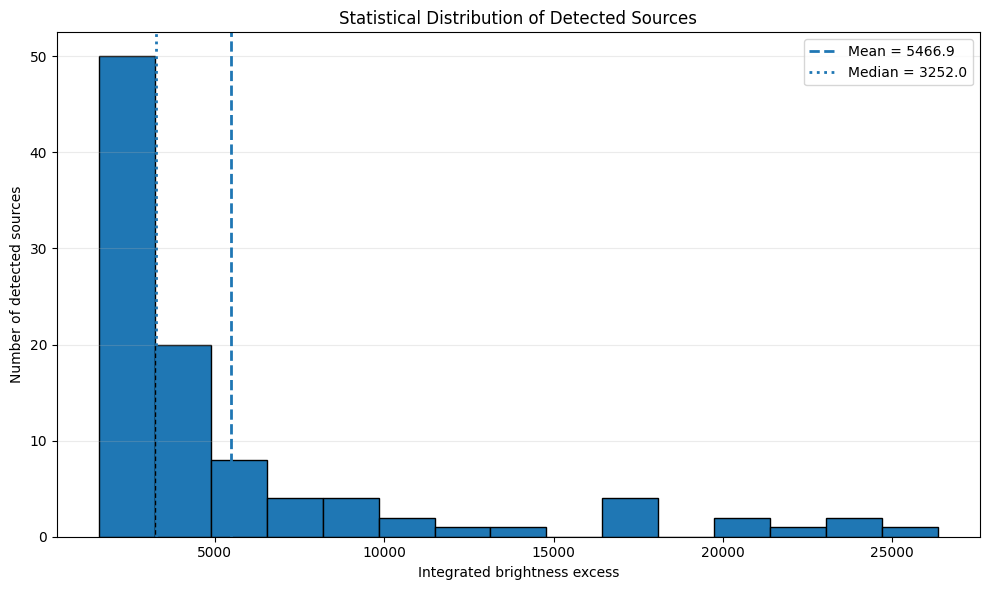
- The integrated brightness-excess values range from approximately 1,572 to 26,355.
- Most detected sources have relatively lower brightness-excess values.
- The mean value (5,466.9) is higher than the median (3,252.0), indicating a right-skewed distribution.
- A small number of sources show substantially higher values than the majority.
Results
The statistical analysis shows that the detected sources are not uniformly distributed in brightness. Most sources have relatively low integrated brightness-excess values, while a smaller number of stronger detections contribute significantly to the mean.
Overall, the histogram indicates a positively skewed distribution with a small number of high-value sources. These measurements represent image-based detection values and should not be interpreted as calibrated astronomical luminosities or distances.
Limitations
- The dataset was manually collected from a single image, so it's small and not a substitute for a proper astronomical catalogue.
- Measurements of position and brightness are approximate, not instrument-calibrated.
- The analysis is a student exercise in applying statistics to real imagery, not a scientific research finding.
What I learned
- How to turn a real astronomical image into a structured, analysable dataset.
- Practical Excel skills for organising and summarising data.
- Using Matplotlib to visualise spatial and statistical data.
- Being careful about the difference between a small illustrative dataset and a scientifically rigorous one.